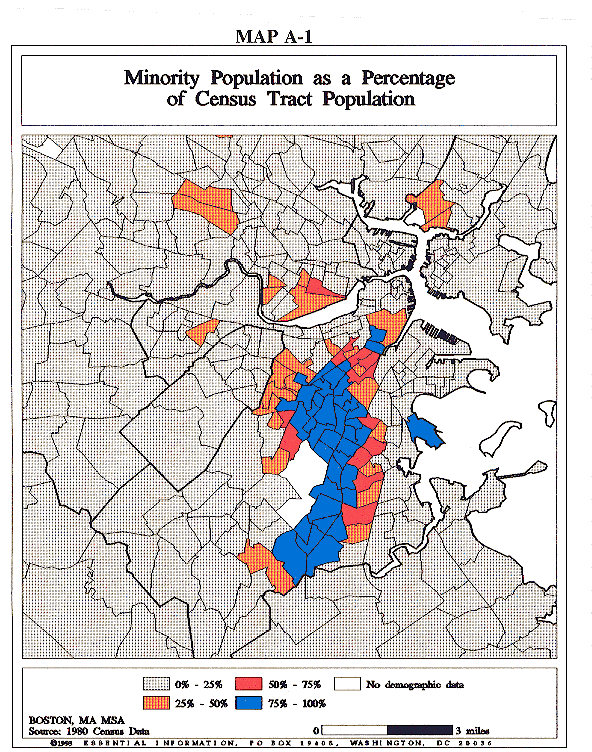
The above is a map from the reported 1980 Census Data, depicting "Minority Population as a Percentage of Census Tract Population" in Boston, Massachusetts. It reflects the Federal Housing Administration's history of promoting racial residential segregation, most notably, through redlining and its mortgage lending policies and practices. The dark blue areas on the map, indicative of communities in which racial minorities constitute 75 to 100% of the total population, expose how racialized lending practices by both the FHA and private banks, as well as numerous forms of de facto segregation, such as racial covenants, shaped neighborhood demographics and concentrated blacks, Latinos, and other minorities in the South Boston region. The persistence of such rigid spatial divisions also highlights the effect of zoning ordinance laws implemented during the 1970's which further limited available, affordable housing and multifamily rental homes in the city.
I chose this map because I am interested in the role of federal agencies in nurturing residential segregation, and the neighborhood-based grassroots movements that erupted following court-ordered school integration in the 1970's. Unfortunately, mortage lending practices appear to still be effecting residential segregation today as they did in the post-World War II period. Research has shown that between 2000 and 2002 in Boston, the rate of denied home loan applications for African-Americans was 18.3 % (2.57 times the rate of 7.1% for whites), and 15.3 % for Latinos (2.14x higher than whites). Such practices have served to perpetuate the patterns of segregation initiated by federal policy. (Jim Campen, "The Color of Money in Greater Boston: Patterns of Mortgage Lending and Residential Segregation at the Beginning of the New Century," The Civil Rights Project- UCLA, 2004).

No comments:
Post a Comment